This entry is part 1 of 2 in the series 1000ml Pillars

The 6 crucial skills Jr Data Scientists need

Yes, you need to model; and so much more!

By VICTOR ANJOS

I speak and write a lot about broken education systems and learning in general and give my readers just a little insight into what to do about it. Well, if you’re an aspiring Data Scientist (or Data Science Analyst), then this post is all about you and the plight of getting your foot in the door.

Obviously, the easiest way to gain these skills is to come to one of our upcoming intro sessions and join in a upcoming cohort. We are still the only Mentor program which has a recruitment (or actually placement) function. It is similar to how executive search works, except this part of our business is exclusively for entry level data candidates.

"I honestly don't know why everyone thinks they need to know neural networks and all take Andrew Ng's Coursera course"

So you want to be a Data Scientist (Part 2)

We dive right back into the question of “What do I really need as an entry level candidate in the data science field?” in this 2-part series on the crucial skills necessary to get started on the right foot in your career.

If you missed the first part, you can find it here in which we talked about the need for data science candidates to ensure they are adept (and demonstrably so) at:

Now we can get into the final steps of a data science project’s life cycle and look at how to Model, Experiment, and Deliver results to Stakeholders.
"Hey you, how can I tell if this campaign is effective?"

Starting use the Acquired (and, now clean) data

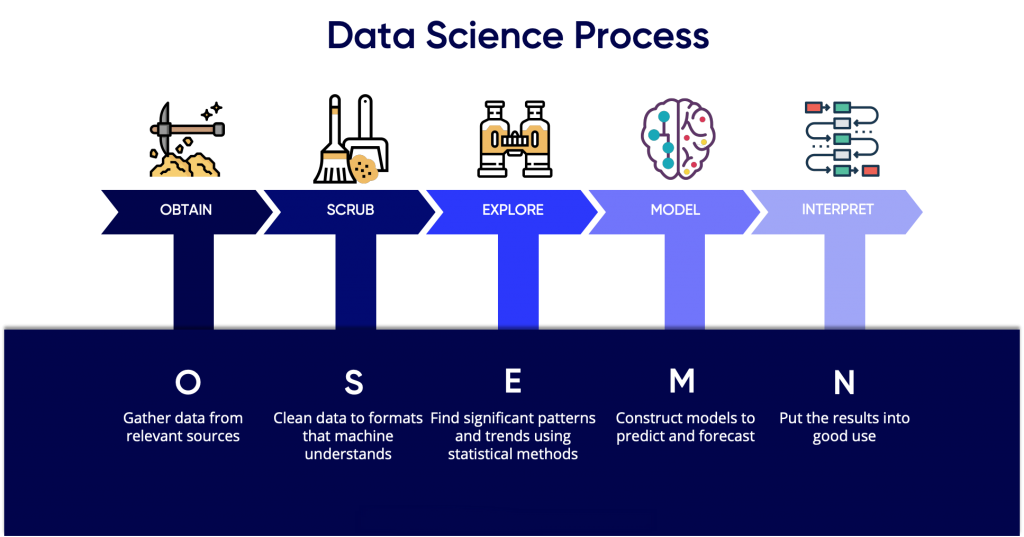
So now we gotten to a place where the data we have is sitting in the right places, whether that be on your local machine, some file storage service or in a database, and you have it sanitized, cleaned and ready for your exploratory, machine learning or deep learning methods.

So what now?

Analysis (or Modeling)

This is generally seen as the “SEXY” part of Data Science or machine learning. It is generally where all the MOOCs, online courses, bootcamps and tutorials online focus. It’s sort of the bench press of a data science project; it’s the part that everyone seems to always focus on, believing that if you model well, you’ll be a good data scientist. Unfortunately, that’s not the whole truth and literally only a sliver of the work required, as you can see from the lengthy series of posts.

Let’s briefly discuss modeling and what it entails, but literally, just briefly, as this topic is the most over-saturated part of data science, ML and AI. Once you have cleaned the data, you have to understand the information contained within at a high level. What kinds of obvious trends or correlations do you see in the data? What are the high-level characteristics and are any of them more significant than others?

Lastly, you will need to perform in-depth analysis (machine learning, statistical models, algorithms). As mentioned above, this step is usually the meat of your project,where you apply all the cutting-edge machinery of data analysis to unearth high-value insights and predictions.

Modeling (specifically)

In order to create a predictive model, you must use techniques from machine learning. A machine learning model takes a set of data points, where each data point is expressed as a feature vector. How do you come up with these feature vectors? In our analysis (or exploratory / EDA) phase, we identified several factors that could be significant in predicting an outcome.
Here you are likely to notice important differences between the several important data points / attributes, such as: age will generally be a numeric value whereas some other feature like marketing method is a categorical value. As a data scientist, you know how to treat these values differently and how to correctly convert them to features.
Besides features, you also need labels. Labels tell the model which data points correspond to which category you want to predict. At this point you are likely augmenting the data set by inserting a new value such as a boolean that says whether someone converted or not. Now that you have features and labels, you may decide to use a simple machine learning classifier algorithm called logistic regression. A classifier is an instance of a broad category of machine learning techniques called ‘supervised learning,’where the algorithm learns a model from labeled examples. Contrary to supervised learning, unsupervised learning techniques extract information from data without any labels supplied.
You choose logistic regression because it’s a technique that’s simple, fast and it gives you not only a binary prediction about whether a customer will convert or not, but also a probability of conversion. You apply the method to your data, tune the parameters, and soon, you’re jumping up and down at your computer.
“If you can’t measure it you can’t improve it”

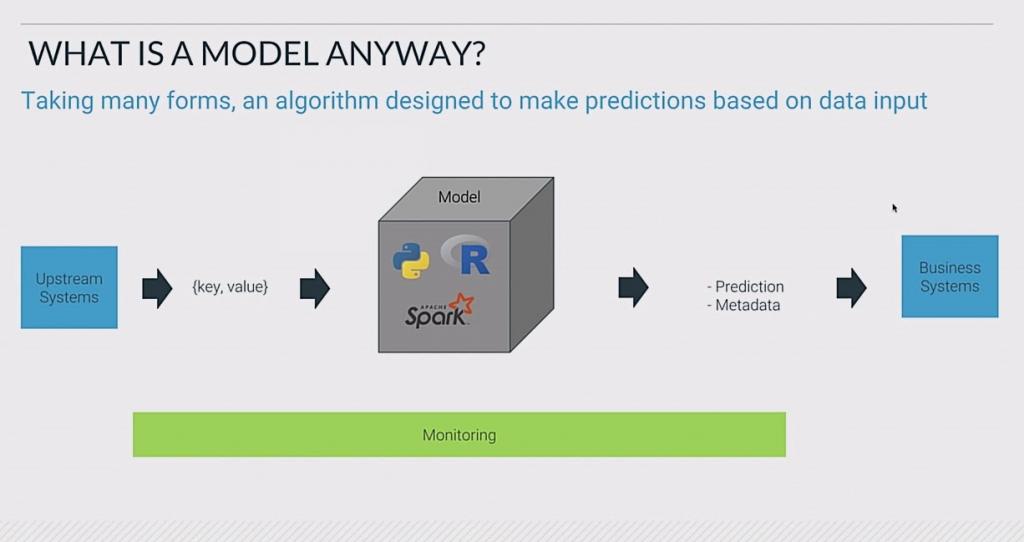
You’ve just modeled something in the real world! But is it a good model? Is it what you want to present? Hmmm… what next?

Experimentation and Model Performance

If you want to control something it should be observable, and in order to achieve sucess, it is essential to define what is considered success: Maybe precision? accuracy? Customer-retention rate? This measure should be directly aligned with the higher level goals of the business at hand. And it is also directly related with the kind of problem we are facing:
  • Regression problems use certain evaluation metrics such as mean squared error (MSE)
  • Classification problems use evaluation metrics as precision, accuracy and recall.

Setting an Evaluation Protocol

Once the goal is clear, it should be decided how is going to be measured the progress towards achieving the goal. The most common evaluation protocols are:
Maintaining a Hold Out Validation Set
This method consists on setting apart some portion of the data as the test set. The process would be to train the model with the remaining fraction of the data, tuning its parameters with the validation set and finally evaluating its performance on the test set.
The reason to split data in three parts is to avoid information leaks. The main inconvenient of this method is that if there is little data available, the validation and test sets will contain so few samples that the tuning and evaluation processes of the model will not be effective.
K-Fold Validation
K-Fold consists in splitting the data into K partitions of equal size. For each partition i, the model is trained with the remaining K-1 partitions and it is evaluated on partition i. The final score is the average of the K scored obtained. This technique is specially helpful when the performance of the model is significantly different from the train-test split.
Iterated K-Fold Validation with Shuffling
This technique is specially relevant when having little data available and it is needed to evaluate the model as precisely as possible (it is the standard approach on Kaggle competitions). It consist on applying K-Fold validation several times and shuffling the data every time before splitting it into K partitions. The Final score is the average of the scores obtained at the end of each run of K-Fold validation.
This method can be very computationally expensive, as the number of trained and evaluating models would be I x K times. Being I the number of iterations and K the number of partitions.

Setting a benchmark

The goal in this step of the process is to develop a benchmark model that serves us as a baseline, upon we’ll measure the performance of a better and more attuned algorithm. Benchmarking requires experiments to be comparable, measurable, and reproducible. It is important to emphasize on the reproducible part of the last statement.
Nowadays data science libraries perform random splits of data, this randomness must be consistent through all runs. Most random generators support setting a seed for this purpose. In Python we will use the
random.seed
method from the random package.
It is often valuable to compare model improvement over a simplified baseline model such as a kNN or Naive Bayes for categorical data, or the Exponentially Weighted Moving Average (EWMA) of a value in time series data. These baselines provide an understanding of the possible predictive power of a dataset. The models often require far less time and compute power to train and predict, making them a useful cross-check as to the viability of an answer. Neither kNN nor Naive Bayes models are likely to capture complex interactions. They will, however, provide a reasonable estimate of the minimum bound of predictive capabilities of a benchmark model.
"Is this model the right model to be presenting? Will my stakeholders get value from this analysis or model?"

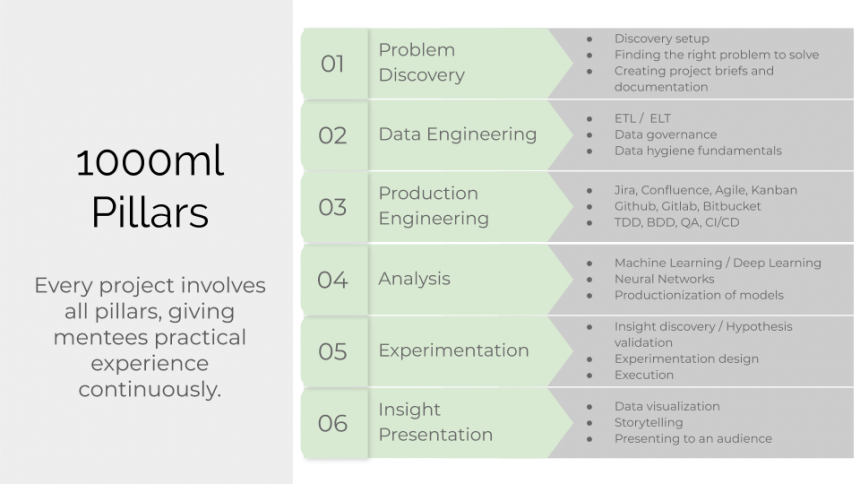
The last; and often most overlooked part of the Data Science project methodology is about communicating the value you’ve just created in this project. So how does that look?

Delivering Results to Stakeholders

Data science and the outcomes it delivers can be complex and hard to explain. Presenting your approaches and findings to a non-technical audience, such as the marketing team or the C-Suite, is a crucial part of being a data scientist. You need to have the ability to interpret data, tell the stories contained therein, and in general communicate, write and present well. You may have to work hard to develop these skills – the same as you would with any technical skills.
It’s not enough just to have the technical know-how to analyse data, create predictive models, and so on – communication skills are equally important. You must be able to explain effectively how you came to a specific conclusion, and be able to rationally justify your approach. You need to be able to convince your audience that your results should be utilized – and you need to motivate how it can improve the business in a particular way. That’s a whole lot of communicating.
Many people in data science stress how important business insight and understanding are. In fact, most definitions of data science list business acumen as a crucial skill. I want to emphasize here that you must ensure that the business insight and understanding flows through very strongly when you present the results of your data science work, especially to business representatives.
For example, you need to:
  • Convey the message in business terms.
  • Highlight the business impact and opportunity.
  • Correctly call out the right call to action.
At the end of the day, it’s those business representatives that have to understand what you are trying to say. They have to act on and possibly make far reaching decisions based on what you say. The least you can do is speak to them in an understandable language.

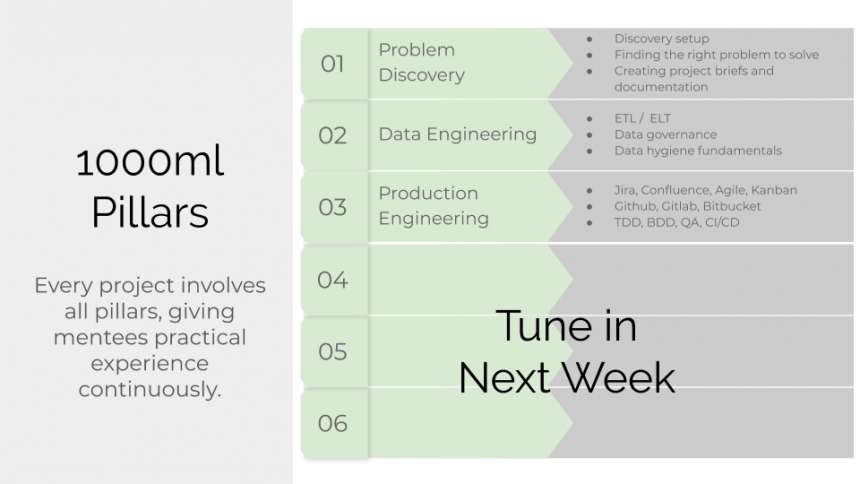
So what do you do when all signs point to having to go to University to gain any sort of advantage? Unfortunately it’s the current state of affairs that most employers will not hire you unless you have a degree for even junior or starting jobs. Once you have that degree, coming to a Finishing and Mentor Program, with 1000ml being the only one worldwide, is the only way forward to gaining the practical knowledge and experience that will jump start your career.

Check out our next dates below for our upcoming seminars, labs and programs, we’d love to have you there.

Be a friend, spread the word!

Series NavigationThe 6 crucial skills Jr Data Scientists need​ >>