Table Extraction with Associated Text

By Karl Davidson

Task background

Computer vision and related tasks are challenging. They are often too finicky, and difficult to get working on more than the image you practiced on. Fortunately, with some work, such tasks are often rewarding as well – having produced a program that successfully reads a collection of images, and returns exactly (or pretty close to) the text you could see on the image. 

My task specifically was to take a look at finding tables within PDF documents (scanned or not), and extract the contents of the table. There are actually more than a few tools that already do this pretty well, which I’ll talk about later. The more difficult part of the task was to also extract and read out any text that was associated with this table. This means captions, titles and/or any other nearby text that directly pertains to the table. Initially this seemed pretty straightforward, but it quickly developed into a nightmare of a task. The following article outlines the methods I used to tackle this problem, so hopefully if you as the reader encounter a similar problem, you at least know where to start! 

Setting up the problem

Gathering up the tools required for this job – we’ll need the table detector, something to extract the table data (lots of details here – borderless and bordered tables require different strategies) and the means to read out that elusive associated text. 

I suggest jumping into Colab for all of your experimentation, that way you can make use of a GPU (big help on speed), unless you have your own, then you do you… 

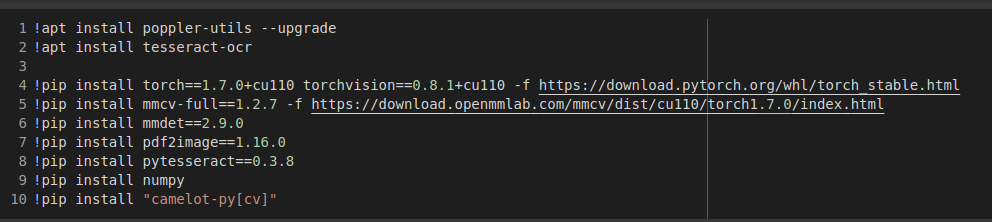
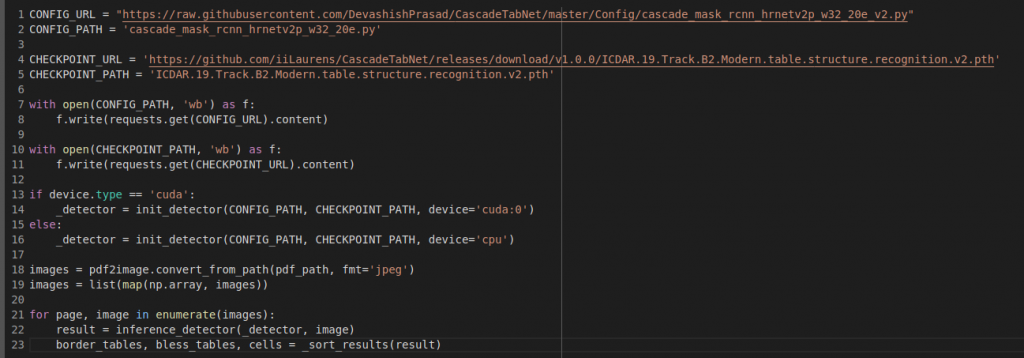
To start, we’ll pick our table detector(s). There’s more than a few out there for sure, since they are mostly just fine tuned image detectors. MMDetection in conjunction with MMCV will be used – they are both subsets of OpenMMLab, a library of image detection, recognition, classification and more. This library is very robust and quite good from my experience with it, albeit finicky, as with all computer vision software. It can be a little tricky to install the right versions of these tools, especially if you’re bringing it into an already hefty list of requirements. At the very least you’ll have to be somewhat specific with your version choice of PyTorch, CUDA and NumPy. Here’s a guide from the docs to get started.

Next up of course we’ll need the usual CV2 (opencv-python), and PyTesseract. Don’t forget that you’ll need to install poppler-utils and tesseract-ocr to your system/Colab (not your environment, i.e. apt install …) for these to work. 

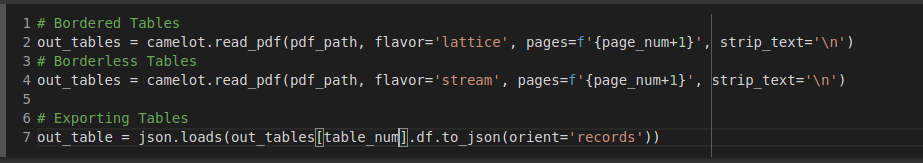
Finally, we’ll need a library called Camelot. This one is particularly optimized for reading table contents, and technically can detect tables as well, but falls quite short of MMDet in this regard. Therefore, we can just feed Camelot the table locations and tell it to read them out.

Here’s an image of the installed libraries and packages mentioned above (written in Colab). The versions used are not always the latest, as there were other dependencies to keep in mind, so these were just the ones I needed. 

Table detection

As mentioned, table detection was performed by MMDet. The software was used out of box, and so the models were downloaded directly from the source. For simplicity, you can download these from their source – the config file and the model file (choose whatever works for you – we liked B2 Modern). 

Once that’s all loaded, we use pdf2image to turn all the pdf pages into a list of NumPy arrays, loop through the images and run each image through the base detection model (mmdet.apis.inference_detector) and there you go! We now know where all the bordered and borderless tables (and combinations thereof) are in the document. Easy, right? 

Here’s the code:

Note that _sort_tables() is a method we used to filter out lower scoring tables/cells – as this usually meant picking up things that weren’t tables. The results are a little hard to decipher, since its just a raw NumPy array, but after some investigation and some help from my colleague who had worked with this previously, it was figured out. For your reference, result[0][i] corresponds to border table positions (i=0), cell positions (i=1) and borderless table positions (i=2) for any given page. 

While the table detection of this model is pretty spot on, cell detection isn’t great, and so we’ll use another tool for that. 

As a final note – MMDet uses pixel coordinates for the pages, so the results for table positions are given as (x1, y1, x2, y2) where point 1 is top left and point 2 is bottom right. The coordinate system follows the same pattern. 

Tables detected!

Reading the tables

This step is particularly involved, and so I won’t go through all of the details but I will present the resources needed to go through the process, and some helpful edits. There are two ways it can be done – the easy way and the hard way.

Camelot

The easy way to read out the tables is Camelot, but there are a few caveats. Again, it doesn’t always detect the tables you want. Also, in order to use Camelot, you must let it detect the tables it is to extract. When it detects the table, this process becomes very easy, and tables are simply extracted. When it doesn’t detect the table, we need to fall back on the other method. Furthermore, if a page is scanned, and not text, Camelot can’t do anything with it. 

Below is the extent of the table detection via Camelot, and its as simple as that.

CV2 and Tesseract

To be clear, Camelot also uses these tools, but is built differently so it was lacking some of the functionality we needed. The method we used made use of a particular coordinate system, and allowed for use with scanned documents, which was necessary for our purposes, but compared to Camelot it is slower and lesser in quality in many instances. I present it to you as a starting point so that it requires less work than I put into it to begin!

To explain the process shortly; for bordered tables, we use cv2 to detect the borders, use those positions to identify cells and their sizes and extract the text from each of these perceived cells. We can return the final data in the same format given by Camelot above. 

For the borderless tables, we first need to do some extra processing to be able to detect the “cells” in the table. This is again done with cv2, but we have to expand the image, and search very specifically where text is and isn’t. We then draw the borders to effectively create a bordered table. Then the table is run through the border table recognition code. 

As mentioned, the code involved in this was gathered up from a few different sources and mostly implemented by a colleague of mine before I took over for some fine-tuning. Here’s a list of articles where that information was found:

  1. Working with borderless tables.
  2. Bordered tables, and how to draw the borders, and pick out individual cell text.
  3. Sorting the cells by contour recognition

Now for a few minor additions/tips to help with this code, and help integrate with the associated text in the next section.

  • Because of the nested nature required in this code, I strongly recommend a logger, otherwise you’ll end up with a very messy stack trace. 
  • The base score thresholds are also a little low from my experience, as the models are quite sensitive.
  • Get familiar with the coordinate system you’re using. Make sure you can always reference the page size (in pixels) via the NumPy arrays of the pages, you’ll need this so that you don’t have to hard code any numbers.
  • Decide on an amount of padding (in pixels) that you want to add to your table/cell detection.
With that out of the way, let’s carry on to the main reason I wrote this article. 

Associated Text

After doing a good amount of research, I concluded that this was a task no one had written about, or provided any insight into online. Anything to do reading the text surrounding a particular object I guess isn’t particularly interesting, but given some applications, I feel its pretty important. 

The issue with this task is that in order to search for the text, we need to use the table as a reference, i.e. image data. How can we know what text is related to a table without having a consistent formatting of the documents being used? Ultimately, I found that the answer to this question (barring some heavy duty ML – which there wasn’t time for), is we can’t. We can’t know whether the caption of a table is going to be 4 words, 4 lines or non existant. What’s the spacing between a table and its title? Inconsistent is what it is. Despite this, I was still able to find a solution that worked about as well as it could. 

My first thought was to build a simple topic model, but being sort of unfamiliar with that and having a time limit, I decided it wasn’t worth it. Plus, when your tables consist mostly of numeric data, it may have been a little difficult to make that work. 

I followed through with my next idea which was the thing that ended up working (with some tweaks, and still persistent imperfections). Given each table, I would search above and below for a certain amount of space. To reiterate, this was done purely with image detection, so I cropped every page that included a table down to bits that were above an below each table. Essentially, one can use the coordinates of the table to pick out these sandwiching boxes. Here’s an example.

Obviously, we don’t need to worry about the x-coordinate (left-to-right), and so we just play around with the y coordinate and our designated padding size. Some of the code above also deals with running into other tables. If while taking a surrounding chunk you would overlap another table, then I just stop at the top of that table. 

Next, we need to read that text, and the thing that does that is pytesseract. There’s a couple of nice functions attached to that – image_to_string() and image_to_data()Converting to string means it picks up everything that could possibly be a string in the image, which when you accidentally include a table border in your image, you get some good nonsense. This was the first method I tried, and while you could do some things to get around the nonsense, it didn’t work for every table, and that’s when I found image_to_data(). This method has the option of outputting a dataframe containing all the words that were in the image chunk. Each word has its own row. Here’s an example.

The important columns are highlighted. Depending on the configuration of tesseract that you chose, you can have more or less “block numbers”. I picked psm 1, and you can find more about each configuration on this stack exchange post. You can see that things are split into these blocks, which roughly correspond to text within a single line of each other, but its not perfect. You can also filter by conf (confidence level). A confidence of -1 usually corresponds to some escape character like “\n” or “\xa0”, and you can ignore these. 

Notice near the bottom that we have some nonsense with low confidence levels (except for that “T”). Therefore, in general we can filter by confidence level and block number to pick out the right text. 

This particular example depicts a table title (so stuff on the top), so we need to make sure we pick the right block. In general, and with decent accuracy, we can pick the first block that isn’t just a single character, starting from either the bottom of the dataframe (if we are looking for top text) or from the top of the dataframe (if we are looking for bottom text). 

Finally, for those pesky instances where the table detection was a bit off center, we can pick up a full row of the table. To sort that out, we simply filter out all the words that were in cells. At first this worried me a little, but given that our tables consisted mostly of numerical data, there was little to no overlapping text. Fortunately, this supported my thoughts to avoid a topic model as well.

With the multiple levels of filtering, we can usually pull out the proper text. My team was happy enough with the result, and we can improve on this later anyway. 

Final Thoughts

Overall, the methods presented above worked as well as they needed to for the task at hand and the time limit. There is certainly some improvement to be made, and maybe I can implement some fancy ML model to make it even better. 

If I wanted, I could probably come up with some hand-wavy way of scoring this method, but I don’t think it would make me feel better or worse about the outcome. I’d say it works pretty well about 70% of the time. The other 30% it either works near perfectly or terribly. A lot of this also depends on the quality of the document, and whether its already text based or scanned. 

I hope that if you as the reader attempt something like this in the future, you can use this as a starting point and save yourself some time. Let me know in the comments if you happen across something else, or can think of any improvements! 

References

I referenced a few things more than once, so in case you missed those: